Use the File/Analytical models menu to start a new AMWELLS model or to work with an existing AMWELLS model.
Model parameters are specified in Analytical model window that is opened after either creating a new model (File/Analytical models/New model) or loading a saved model (File/Analytical models/Open model).
You can operate AMWELLS in the following five modes:
1) the Edit mode: allows editing well data and time measurements. AMWELLS operates in this mode when you start a new model or when the modes 2-4 are disabled;
2) Observation point mode: this mode is activated by selecting the "Value" tool (![]() ) from the Toolbar menu. When this mode is on, two perpendicular red lines appear on the graphical interface window;
) from the Toolbar menu. When this mode is on, two perpendicular red lines appear on the graphical interface window;
3) Model grid mode;
4) WHPA mode and
5) Pit mode.
AMWELLS editor window displays the model area, the model profile, the toolbar and the status bar. The toolbar is located to the right of the model area, and the model profile is immediately below the model area.
The status bar is located at the bottom of the AMWELLS window and displays information as the cursor moves across the model. This information is comprised of:
X, Y – cursor position when it is located over the model area;
Z – cursor position when it is located over the model profile;
L – cursor distance from a boundary (for bounded aquifers);
R – cursor distance from the borefield centre (indicated by a green dot on the model area); and
Xc, Yc – coordinates of the borefield centre.
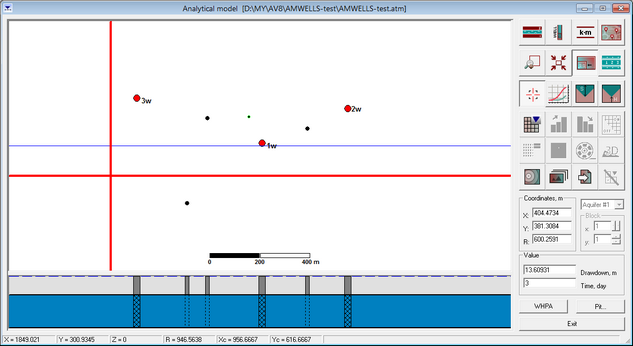
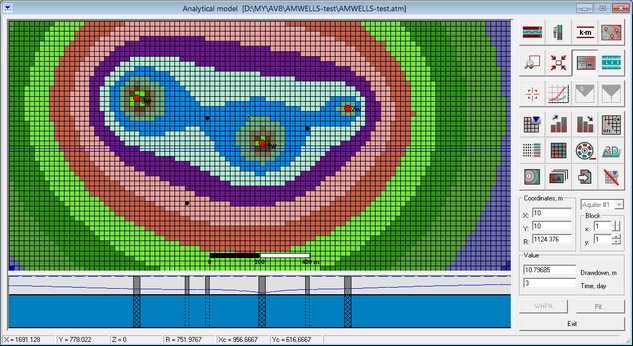
Examples of AMWELLS graphical window in the Observation point mode (top) and the Model grid mode (bottom)
Toolbar menu
|
Specifies basic model parameters (i.e. dimensions, coordinates) and determines how the model is displayed. Opens dialog "Model dimensions" |
|
Dialog prompts input of pumping and monitoring wells, their construction details, distances between wells and production rates. The assigned time-series will be used by AMWELLS to calculate transient drawdown maps and borehole hydrographs. Opens dialog "Wells and time measurements" |
|
Selection of parameters to assign aquifer properties. Opens dialog "Model parameters" |
|
Displays a basemap. You may click the browse button to find the correct file. Opens dialog "Picture" |
|
Zoom allows you to magnify a selected area on the current display |
|
View full model extent |
|
Displays the model width and length in real-world proportions. If this tool is not checked, the model area extends over the whole plan view |
|
The measure tool lets you measure distances on the map. Use this tool to draw a line on the map and get its length or input coordinates and calculate the distance between them. Opens dialog "Distance" |
|
This option draws plots for drawdown and piezometric heads at the location selected in the aquifer. Clicking this option enables the "Plot” tool that is used to draw boreholes and aquifer hydrographs. Switching to “Observation point mode” |
|
The “Plot” tool is used to draw hydrographs and piezometric head profiles. Opens dialog "Plot" |
|
Calculates drawdowns at the point selected in "Value" menu |
|
Calculates piezometric heads at the point selected in "Value" menu |
|
Opens options to run an AMWELLS model with specified parameters, loading previously saved results and switching to “Model grid” regime. This regime enables several display options including color flooding, contouring and 3D animation. Opens dialog "Run of analytical model" |
|
Searches a model cell with maximum drawdown. Click this option while holding the “Shift” key, the search will be performed for the selected time. This option is enabled in “Model grid” regime only |
|
Searches model cell with minimum drawdown. Click this option while holding the “Shift” key, the search will be performed for the selected time. This option is enabled in “Model grid” regime only |
|
Displays/hides the grid. The model grid is not displayed when this option is checked. This option is enabled in “Model grid” regime only |
|
This option sets up the range of values over which colors are displayed. You may change the colors, the number of intervals and the drawdown value assigned to the bounds on each intervals. This option is enabled in “Model grid” regime only. Opens dialog "Classed post map properties" |
|
Displays a specified drawdown interval by a selected color or by a random color (double click of mouse left button). This option is enabled in “Model grid” regime only. Opens dialog "Trace" |
|
Animation of transient variations of piezometric surface. This option is enabled in “Model grid” regime only. Opens dialog "Animation" |
|
3-D view of AMWELLS grid and modelling results. This option is enabled in “Model grid” regime only. Opens dialog "3D view" |
|
Creates contours (isolines) of piezometric heads based on AMWELLS modelling results. Opens dialog "Groundwater potentiometric map" |
|
Saves the current view as a figure in the clipboard |
|
Exports model results to a text file ( .dat) or as a figure ( .bmp) |
|
Exit “Model grid” regime |
Frame “Coordinates” |
The text boxes allow selecting the location at which drawdown is calculated X and Y – coordinates (meters); R – distance from a production well (meters). When moving the cursor on the text boxes “X” or “Y” while pressing INS, the coordinates automatically change to those of the borefield centre. The frame is activated in "Value" menu |
List |
Allows selecting a specific aquifer if you are working with a multi-layer aquifer system |
Frame "Block" |
Number of a model block in x and y directions for “Model grid” regime |
Frame "Value" |
The dialog calculates the drawdown (meters) for a selected time (days from the start of production) and specified location. Field “Time” allows selecting the time for which the drawdown is calculated |
WHPA |
Delineation of Wellhead Protection Areas. This option is disabled in “Model grid” regime |
Exit |
Exit AMWELLS module |
The hot-keys for working with AMWELLS models
Ctrl-Left Mouse Button anywhere over the model area |
Add production well |
Ctrl-Alt-Left Mouse Button anywhere over the model area |
Add observation well |
Right Mouse Button over a production or observation well |
Delete well |
Left Mouse Button over a production or observation well and moving the cursor |
Move well to a new location |
Double click on Left Mouse Button over the model area |
Open “Model dimensions” dialog window |
SHIFT+Left Mouse Button over a production or observation well |
Open dialog window “Wells and time measurements” |
Right Mouse Button over a cross-section area |
Remove cross-section from the screen |
Ctrl+T |
Insert text box. Double click on the text box opens a “Caption” dialog where text can be formatted and edited |