You can create contours (isolines) of piezometric heads or drawdowns based on the AMWELLS modeling results. In WHPA mode contours (isolines) of piezometric heads only are created.
|
– button “Groundwater contours” in the Toolbar menu. |
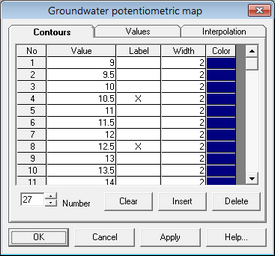
Tab "Contours" |
Sets up the contours format (color, width, contoured value, labeled contours) |
|
Field "Number" |
Defines how many contour lines will be drawn |
|
Button "Clear" |
Deletes all contour lines from the map |
|
Button "Insert" |
Adds a new contour between the current contour and the next one. The value of the new contour corresponds to the average of its immediate neighbors |
|
Button "Delete" |
Deletes the contour line under the mouse cursor |
|
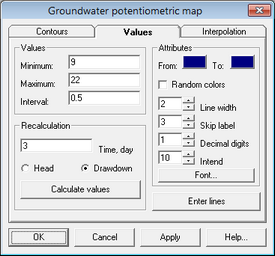
Tab "Values" |
Defines contour values, labels and their format |
|
Frame "Values" |
Defines minimum and maximum contour values and contour interval |
|
Frame "Recalculation" |
Specifies elapsed time (in days) for contours design. Selects between hydraulic head and drawdown contours. Clicking SHIFT+Left mouse button will launch the dialog for time units conversion. Clicking CTRL+Left mouse button will open the text box with the highlighted time value converted in different units |
|
Button "Calculate values" |
Calculates minimum, maximum and interval values for contouring based on the values entered in the frame "Recalculation" |
|
Frame "Attributes" |
Automatic settings for contour and label formats. Formats of individual isolines can be manually edited in the tab "Contours" |
|
Button "Enter lines" |
Recalculates the tab "Contours" based on the selected values in the tab "Values" |
|
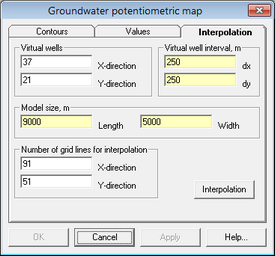
Tab "Interpolation" |
The contour lines are created based on interpolation between pumping wells, observation wells and additional (virtual) wells. This tab sets virtual wells and launches the interpolation process. Virtual wells are introduced in order to create piezometric maps that are constrained not only by interpolation algorithms but also by hydrodynamic equations at various locations of the aquifer. The approach is important in cases where only a few observations or pumping wells exist, since pure mathematical interpolation could result in conceptually unrealistic piezometric tables |
|
Frame "Virtual wells" |
Specifies quantity of virtual wells that are introduced in the X-direction and the Y-direction. This quantity will impact the reliability of predictions, as fewer virtual wells will result in a less conceptually correct piezometric map. On the other hand, a high number of virtual wells will increase simulation time. By default, 21 virtual wells are introduced along the short axis and a proportionally higher number along the long axis |
|
Frames "Virtual well interval" and "Model size" |
These fields are only for information and can not be edited. The frame "Virtual well interval" shows a spacing that is calculated by dividing the value in the frame "Model size" on quantity of virtual wells in the X-direction and the Y-direction |
|
Frame "Number of grid lines for interpolation" |
These fields define the grid density for interpolation purposes |
|
Button "Interpolation" |
Interpolates existing and virtual observation over the defined interpolation grid. The interpolation is conducted using ordinary kriging method that is incorporated in the CSLIB module Deutsch C.V., Journel A.G. GSLIB: Geostatistical Software Library and User's Guide, Oxford University Press, New York, 1992. |