The dialog window "Plot" is accessed from the Observation point mode and the Model grid mode. In the Observation point mode, drawdawn (piezometric head) versus time plots may be generated for any specified observation location. In the Model grid mode, this option allows drawing hydrographs and profiles based on the AMWELLS results for a model grid.
|
– Button “Plot” in the Toolbar menu. |
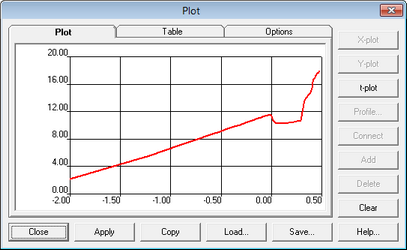
Tab "Plot" |
Displays a calculated hydrograph/profile plot |
|
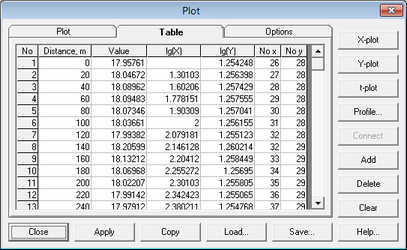
Tab "Table" |
Displays the results in a tabulated form |
|
Column "No" |
Index number of a measurement/observation |
|
Column "Time" or "Distance" |
Elapsed time (in days) for a hydrograph plot. Distance from the observation location on the plot for a profile plot (Model grid mode only) |
|
Column "Value" |
Drawdown or piezometric head value (in meters) |
|
Column "lg(X)" |
Logarithmic value for either Time or Distance |
|
Column "lg(Y)" |
Logarithmic value for either drawdown or piezometric head |
|
Column "No x" |
Index number of a model cell in the X-direction (for the Model grid mode only) |
|
Column "No y" |
Index number of a model cell in the Y-direction (for the Model grid mode only) |
|
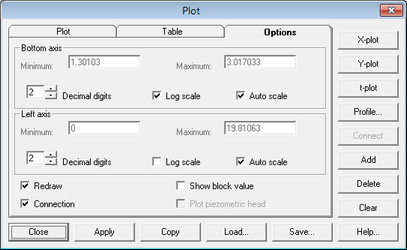
Tab "Option" |
Specifies whether piezometric head or drawdown is plotted. Defines axes types, formats and scale |
|
Frames "Bottom" or "Left axis" |
Specifies the coordinate axes settings |
|
Option "Redraw" |
Redraws the graph and deletes the previous plot |
|
Option "Show a block value" |
Shows the value for the selected cell by a green horizontal line on the plot |
|
Option "Plot piezometric head" |
When this option is checked in the Hydrograph mode, hydraulic head versus time is plotted. For the unchecked option, drawdown versus time is plotted |
|
Buttons "X-plot", "Y-plot" |
In the Model grid mode, this option plots a profile in the X (Y)-direction through the mouse cursor position |
|
Button "t-plot" |
Plots a hydrograph for an observation point at either selected model cell (Model grid mode) or selected observation location (Hydrograph mode) |
|
Button "Profile" |
Plots profiles based on the AMWELLS results for a model grid (Model grid mode). The window is opened by clicking "Profile" button from the tab "Plot" of the "Plot" Toolbar menu. At least two cells must be selected for plotting a profile to enable this option. Cells are highlighted by a white color |
|
Button "Add" |
This option is enabled only in the Model grid mode. It adds the piezometric head or drawdown value at the selected cell location to the plot. The mouse cursor location is highlighted by a blue color on the graphical interface window and shown as cell coordinates in the frame below the Toolbox menu. After the selection, the cell changes to a white color and, when two cells are selected, a connection line is drawn along which a piezometric (drawdown) profile is calculated. If the option "Connection" is checked (Tab "Option"), the white points are automatically connected by a line. To connect them manually, use the button "Connect" on the right side of the plot panel |
|
Button "Delete" |
Deletes the last highlighted point from the plot |
|
Button "Clear" |
Deletes the entire plot. In the Model grid mode all profile observation points are deleted |
|
Button "Close" |
Exits the "Plot" dialog window |
|
Button "Apply" |
Applies changes to the plot |
|
Button "Copy" |
Copies the first two active columns ("Time"/"Distance" and "Value") from the tab "Table" on the Clipboard, so they can be pasted somewhere else |
|
Button "Load" |
Loads a tab- or space-delimited ASCII file with existing heads (drawdown) versus time or distance and adds the data to the plot |
|
Button "Save" |
Saves the plotted data as a table in an ASCII file format |