The dialog window "Plot" can be used in the Model grid mode for drawing hydrographs and profiles based on the AMWELLS results for a model grid. The window is opened by clicking the "Profile" button from the tab "Plot" of the "Plot" Toolbar menu.
The window "Profile" shows the piezometric level profile, as a blue line, for the specified time. The blue dashed line on the profile marks the initial piezometric level. The profile figure also includes projected production and observation wells as well as model layers.
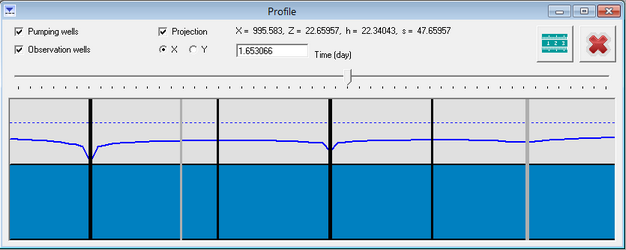
Option "Pumping wells" |
Shows pumping wells by thick vertical lines |
Option "Observation wells" |
Shows observation wells by thin vertical lines |
Option "Projection" |
Project wells that are not located directly on a profile line along the X-direction ("X" option checked) or the Y-direction ("Y" option checked). These wells will be indicated by thin grey vertical lines on a profile figure |
Text box "Time" |
Time for which the profile is plotted. Time units are specified in the dialog window "Run of analytical model". CTRL+left mouse button will launch an information window with conversion of the current time to other time units |
|
Measure tool to measure distances between two profile locations. Opens the dialog window "Distance" |
|
Closes the window and returns to the "Plot" dialog |
