The dialog window “Wells and time measurements” allows inserting, editing and deleting production (pumping and injection) and observation wells. Duration of pumping, frequency of measurements and times for predictions are also specified. These specified times are used by AMWELLS to draw borehole hydrographs at selected locations as well as to simulate the variation in time of for simulation of time-variable piezometric and drawdown maps.
|
– button “Wells and time measurements” in the Toolbar menu. |
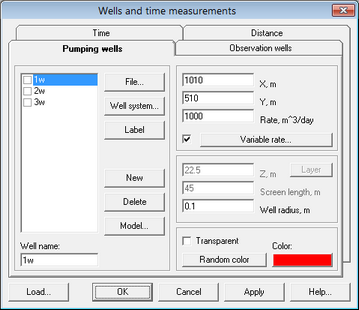
Tab “Pumping wells” |
Specifies quantity, locations, construction details and production rates of pumping wells |
|
Frame “List of pumping wells” |
Shows production wells that are currently in the model |
|
Field “Well name” |
Changes the name of a production well |
|
Button “File” |
The “Import” feature provides a way of reading well data from standard text files, such as DAT or TXT . These files may be created from spreadsheets, text editors, or customized programs. An uploaded file must contain four columns in the following order: x-coordinate, y-coordinate, production rate and a well name. After a well appears in the list and it is highlighted by the cursor, additional well-related data can be added from the rectangular areas on the right (i.e. well radius or variable pumping rate) |
|
Button “Well system” |
Allows to design a borefield of various configurations. Launches the dialog window “Create well system” |
|
Button “Label” |
This menu allows labeling production wells and changing label locations, fonts and formats |
|
Button “New” |
Adds a new production well with a name “*w”. The new well has the same settings as highlighted well in the list |
|
Button “Delete” |
Deletes the highlighted well |
|
Button “Model” |
Inserts a new production well in the interactive regime. Selecting this menu item redirects to the AMWELLS graphical interface window. A new production well is inserted by clicking the left mouse button. After that, the screen automatically returns to the “Wells and time measurements” dialog. ESC key redirects to that dialog without inserting a new well |
|
Fields “X”, “Y” |
Specifies the coordinates of a production well (in meters) |
|
Field “Rate” |
Assigns a time-constant pumping rate (positive value) or injection rate (negative value) Production rate is assigned in m^3/d. Clicking “Ctrl(Shift)-left mouse button” will open a window with the assigned pumping rate converted in other units |
|
Button “Variable rate” |
When this option is checked, the AMWELLS model requires to specify a variable pumping well. Selecting this menu item launches the dialog window “Variable rate” |
|
Field “Z” |
Vertical distance (Z, m) between the screen center and the model top. By default this value is equal to the half of the aquifer thickness |
|
Field “Screen length” |
Defines a screen length for partially penetrating wells. If not specified, the screen length is taken as equal to the aquifer thickness |
|
Field “Well radius” |
Radius of the well |
|
Button “Layer” |
Assigns a screen length equal to the aquifer thickness |
|
Frame “Color” |
Selects color to display a well or assigns a random color. A well symbol can be either filled or empty (when the “transparent” option is checked) |
|
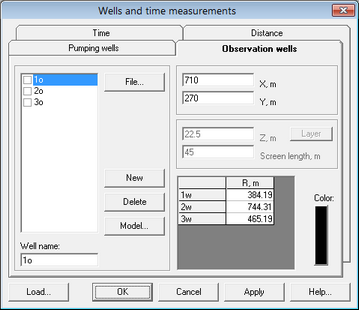
Tab “Observation wells” |
Specifies quantity, locations and construction details of observation wells |
|
Field “Well name” |
Changes the name of an observation well |
|
Button “File” |
The “File” feature provides a way of reading well data from standard text files, such as DAT or TXT. These files may be created from spreadsheets, text editors, or customized programs. An uploaded file must contain three columns in the following order: x-coordinate, y-coordinate and a well name. After a well appears in the list and it is highlighted by the cursor, additional well-related data can be added from the rectangular areas on the right (i.e. well radius) |
|
Button “New” |
Adds a new observation well with a name “*p”. The new well has the same settings as the highlighted well in the list |
|
Button “Delete” |
Deletes the highlighted well |
|
Button “Model” |
Inserts a new observation well in an interactive regime. Selecting this menu item redirects to the AMWELLS graphical interface window. A new observation well is inserted by clicking the left mouse button. After that, the screen automatically returns to the “Wells and time measurements” dialog. ESC key opens that dialog without inserting a new well |
|
Fields “X”, “Y” |
Specifies coordinates of an observation well (in meters) |
|
Field “Z” |
Vertical distance (Z, m) between screen centre and the model top. By default this value is equal to the half of the aquifer thickness |
|
Field “Screen length” |
Defines a screen length for the partially penetrating well. If not specified, a screen length is taken as equal to the aquifer thickness |
|
Button “Layer” |
Assigns a screen length equal to the aquifer thickness. You can use this field only for the conceptual schemes that accounts for partial penetration of an observation well |
|
Table |
The table on the right bottom side of the "Observations well" dialog window indicates distances (in meters) between the active production well and each observation well |
|
Button "Color" |
Selects color to display an observation well |
|
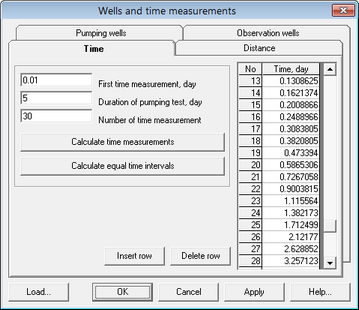
Tab "Time" |
Allows entering elapsed time (in days) since the start of the test and duration of pumping/injection. Clicking SHIFT+Left mouse button in the "Time" field or table will launch the dialog for time units conversion. Clicking CTRL+Left mouse button in the "Time" field or table will open the text box with the highlighted time value converted in different units |
|
Text box "First time measurement, day" |
Specifies the time of the first measurement |
|
Text box "Duration of pumping test", day |
Specifies duration of a test including recovery time |
|
Text box "Number of time measurements" |
Requires the number of time intervals for water level measurements |
|
Button "Calculate time measurements" |
Creates a time measurements table based on the three field entries above and a logarithmic function |
|
Button "Calculate equal time intervals" |
Creates a time measurements table with equal time intervals and based on the three field entries above |
|
Time measurements table (right side of the "Time" tab window) |
Time series used by AMWELLS. The table is constructed based on the fields and buttons on the left side of the "Time" tab window. It is required that each time value is always higher than the previous one. The table allows adding, deleting and editing time values |
|
Button "Insert row" |
Adds row at the position of the cursor to allow entering additional time |
|
Button "Delete row" |
Deletes row at the position of the cursor |
|
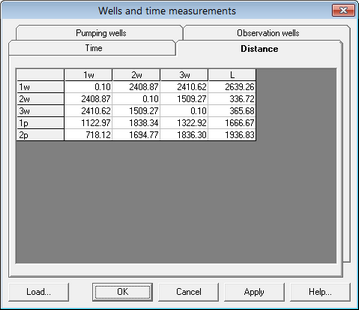
Tab "Distance" |
Shows distances between all input wells. For a production well this table contains its radius. For bounded aquifers, the table includes distances to their boundaries. This tab is for information only and does not allow editing |
|
Button "Load" |
Imports well data or time measurement tables from existing AMWELLS and ANSDIMAT models. Clicking this button will load different types of data and associated files in each tab window: Tab "Pumping wells" – AMWELLS file well.am Tab "Observation wells" – AMWELLS file obswell.am Tab "Time" – AMWELLS file runtime.am Tab "Distance" – ANSDIMAT file wellcord.e. The file contains well coordinates, their pumping rates and observation times |