For all conceptual models ANSDIMAT provides the opportunity to open a number of supplemental windows displaying basic diagnostic plots. Plots in these windows are for viewing only and do not allow test analysis.
Windows are launched from the main menu "View > All plots" to load all plots, or by selecting the required plot.
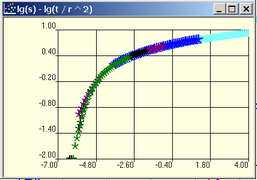
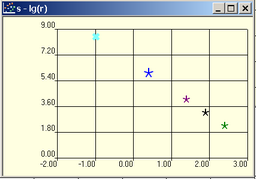
Examples of view plots.
To change a coordinate axis or to select observation wells (by default all observation wells from the main plot are loaded), open the dialog box "Options" by double left click on the field of the plot.
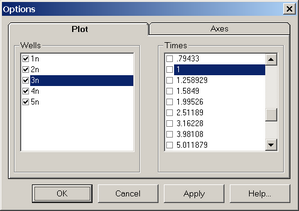
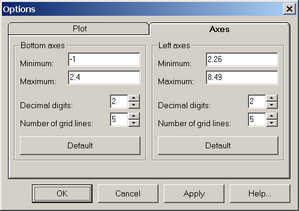
Dialog box "Options".
Explanatory table
Tab "Plot" |
Selects data for diagnostic plots |
|
List box "Wells" |
Selects observation wells for diagnostic plots |
|
List box "Times" |
Selects observation points for distance-drawdown plot |
|
Tab "Axes" |
Specifying coordinate axes |
|
"Minimum" text box |
Minimum value along the axis |
|
"Maximum" text box |
Maximum value along the axis |
|
"Decimal digits" text box |
Number of digits after decimal point |
|
"Number of grid lines" text box |
Axis spacing |
|
"Default" button |
Default settings of coordinate axis |