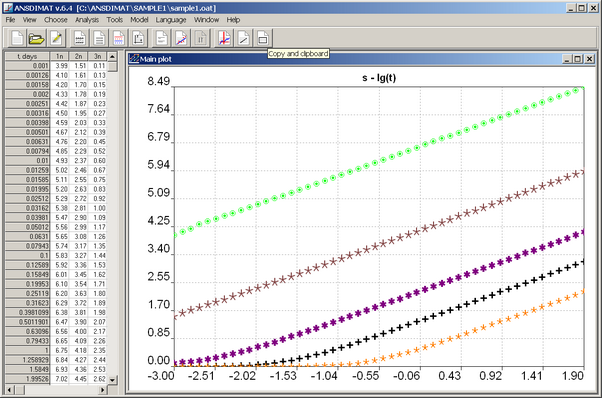
Loading a file for interpretation launches "Main plot" window displaying the data as a drawdown vs time and a panel to the left of the plot that presents obsrevation data time series.
"Main plot" dialog box.
Main operations
To make plot in other coordinates, use the "Choose > Plot" menu or right click on the plot field.
To select observation wells or observation points use the menus "Select > Well" and "Select > Time".
For data analysis and interpretation, use the menu "Analysis". Right click on the lower left corner of the plot allows solving the direct problem.
To change coordinate axis, use open the menu "Tools > Axis properties" or double left click on the coordinate axis field.
The view settings of diagnostic curves can be changed using the menu "Tools > View of curves" or by double left clicking on the plot field.
The menu "Tools > Value" enables scanning of observation and calculation data.
"Tools > Copy and clipboard"allows duplicating the plot window and copying the plot to the clipboard.
A right click in the first column of the data table "t, days" opens a dialogue box for unit conversion. The default time unit in ANSDIMAT is days.