The dialog box "Axis properties" enables modifications of plot axes attributes.
"Axis properties" dialog box
Explanatory table
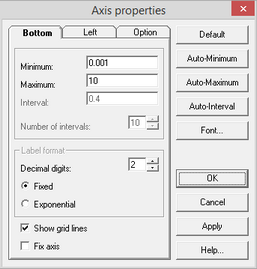
"Bottom" tab |
Modifications for the vertical (y) axis setup |
|
"Left" tab |
Modifications for the vertical (x) axis setup |
|
"Minimum" text box |
Changes the axis minimum value |
|
"Maximum" text box |
Changes the axis maximum value |
|
"Interval" text box |
Length of the interval between two marks on the axis |
|
"Number of intervals" text box |
Number of marks on the axis |
|
"Label format" frame |
||
"Decimal digits" text box |
Number of decimals |
|
"Fixed" option |
Fixed format of axis labels (e.g. 0.45) |
|
"Exponential" option |
Scientific format of axis labels (e.g. 4.5E-0.1) |
|
"Show grid lines" option |
Displays or hides grid lines |
|
"Fix axis" option |
When redraw a plot (for example, the same plot with other observation wells), the values of the coordinate axis (minimum, maximum, and step) do not change |
|
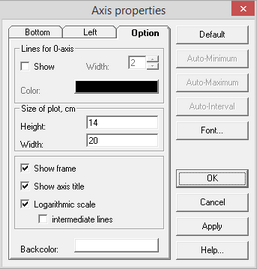
"Option" tab |
||
"Show lines for 0-axis" option |
Highlight the vertical and horizontal lines crossing at the origin point |
|
"Width" text box |
Width of the lines |
|
"Color" button |
Color of the lines |
|
"Size of plot" frame |
Dimensions of the plot in centimeters |
|
"Height" text box |
||
"Width" text box |
||
"Show frame" option |
Draws a plot frame |
|
"Show axis title" option |
Displays on the plot the title of the coordinate axes |
|
"Show logarithmic scale" option |
For plots plotted in the logarithmic coordinates of time, drawdown (recovery) or distance (s - log t, s - log r, log s - log t, log s - log r), the values of the coordinate axis contain the actual value of the parameter, and not its logarithm |
|
"Intermediate lines" option |
Shows intermediate grid lines on a logarithmic plot |
|
"Backcolor" button |
Selects the background color |
|
"Default" button |
Returns all parameters to default values |
|
"Auto-Minimum" button |
Automatic selection of the minimum value on each axis |
|
"Auto-Maximum" button |
Automatic selection of the maximum value on each axis |
|
"Auto-Interval" button |
Automatic selection of the number and length of intervals between 2 marks on each axis |
|
"Font" button |
Font selection |