For complex aquifer test analysis (boundary influence, variable rate, multi-well test, partially penetrating wells etc.), aquifer parameter estimation using normal diagnostic plots (time-drawdown, distance-drawdown, time-distance drawdown) is often difficult, or even impossible. The modification of related flow equations allows plotting drawdown in a coordinate system allowing the application of graphical methods for parameter estimation.
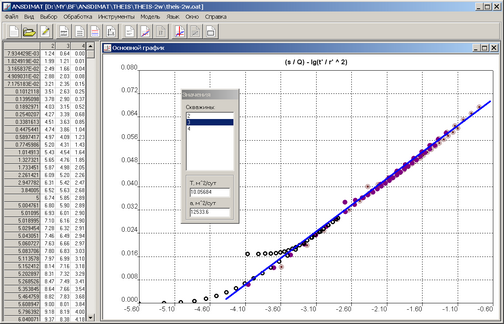
Example of time-distance-drawdown plot for multi-well pumping test at variable rate: parameter estimation by straight-line method on (s / Q) - lg(t' / r'2) plot. The ordinate axis is drawdown : rate ratio, the abscissa – dimensionless time and distance.
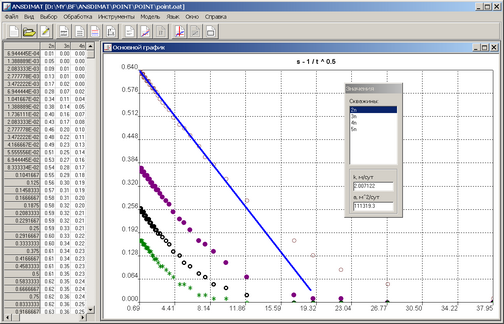
Example of time-drawdown plot for partially penetrating well: parameter estimation by straight-line method on s - 1 / t0.5 plot.
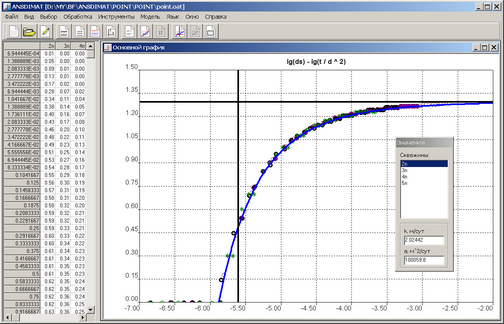
Example of time-distance-drawdown plot for partially penetrating well: parameter estimation by method of type line on lg(ds) - lg(t / d2) plot.
For semi-infinite (profile bounded) or bounded (strip aquifer) conceptual models, the one-dimension plot of drawdown in observation wells for selected observation points is used (menu "Choose > Time") rather than the basic distance-drawdown plot s - lg(r). If time points are not specified, ANSDIMAT uses the last measurement. Using this plot means the direct problem can be solved: observed and calculated data are compared for given parameters values.
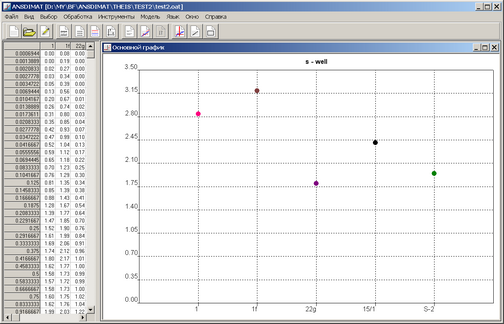
Example of drawdown vs observation well plot s - well.