Diagnostic plots allow estimating aquifer parameters based on aquifer test analysis. ANSDIMAT includes a series of diagnostic plots accessible from the menu "Choose > plot" or directly by pressing the F3 key. Depending on the model, some options are not available: for example, distance-drawdown and time-distance drawdown plots are not available for bounded and semi-bounded models as well as for multiple wells pumping.
For time-drawdown and time-distance drawdown plots, observation wells can be selected from the menu "Choose > wells" or by pressing the F2 key. Observation points can be selected in the menu "Choose > time" or by pressing Ctrl + F2. If no observation well is selected, all available wells will be displayed. The distance-drawdown plot is commonly based on the last measurement point unless observation points are specifically selected.
The table below presents the basic diagnostic plots included in ANSDIMAT as well as the group of methods that are used with that diagnostic plot.
Table of diagnostic plot basic types
Plot |
Example |
Name |
Method of parameters estimation |
|
|
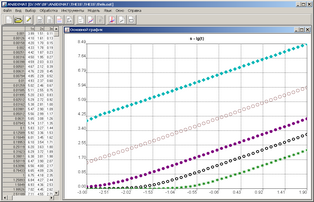
time-drawdown plot |
Parameters matching and straight-line method |
|
|
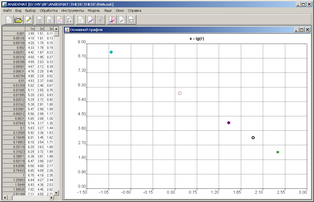
distance-drawdown plot (by default, the plot is based on the last observation point unless specific observation points were selected) |
Parameters matching and straight-line method |
|
|
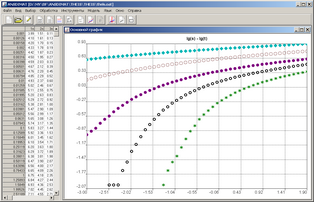
time-distance-drawdown plot |
Parameters matching and straight-line method |
|
|
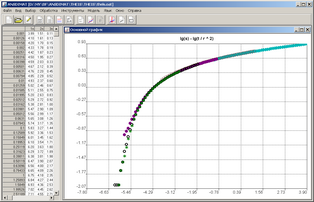
time-drawdown plot |
Parameters matching and type curve method |
|
|
time-distance-drawdown plot |
Parameters matching and type curve method |
|
|
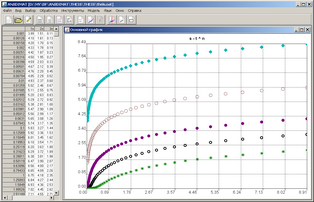
time-drawdown plot (n -index of power) |
Parameters matching |