The "Settings" dialog box allows editing the appearance of curves and plot components. Settings are saved in ANSDIMAT.
The dialog box is launched from the main menu "File > Settings".
"Settings" dialog boxes.
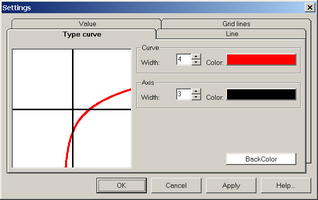
"Type curve" tab |
Tuning the type curve plot appearance: color and width of the type curve itself and plot axes |
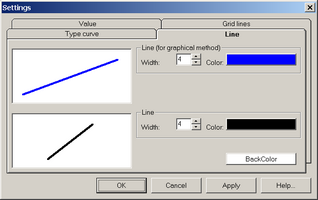
"Line" tab |
Tuning the width and color of the lines for straight-line method and straight-line interval search |
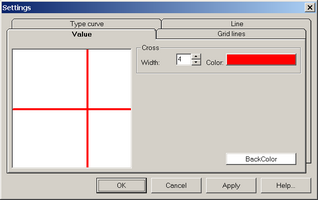
"Value" tab |
Tuning color and width of intersecting lines for data viewing |
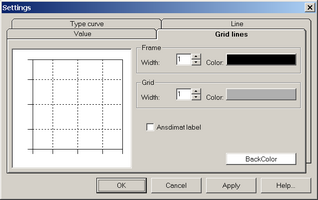
"Grid lines" tab |
Tuning the width and color of axes |
"Ansdimat label" option |
Adds the ANSDIMAT website address on the main plot (we would be grateful if you enabled this options on figures in reports and publications, thank you) |
"BackColor" button |
Changes background color for the main plot |