The straight-line method is applicable for time-drawdown, distance-drawdown and time-distance drawdown plot analysis. Additionally, for some of the conceptual models, the method is also applicable to plots of dimensionless time and dimensionless distance for pumping wells (e.g. for bounded aquifers or multi-well tests).
The "Value" floating window displays previously selected wells (or observation points on distance-drawdown plot) together with parameters estimated by straight-line method. It appears simultaneously with the straight line.
The method is enabled, when the selected conceptual model allows, and it is commonly suitable for the quasi-steady-state section of the diagnostic curve.
The initial straight line is calculated by minimizing the distance between observation points and the straight line.
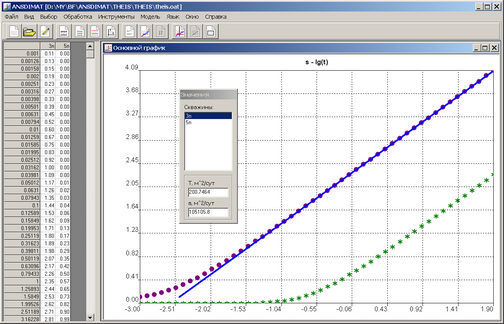
Aquifer test analysis by straight-line method.
Key functions for straight-line method
LEFT, RIGHT |
Moves the straight line left/right |
UP, DOWN |
Moves the straight line up/down |
HOME, END |
Moves the straight line left ending up/down |
PgUp, PgDn |
Moves the straight right ending up/down |
"1" |
Reduces the step width twice |
"2" |
Increases the step width twice |
"3" |
Reset the initial step width |
"+", "–" |
Maximizes/minimizes the straight line |
Left mouse click in the plot field |
Moves the straight line left ending to the cursor position |
Right mouse click in the plot field |
Moves the straight line right ending to the cursor position |
ENTER |
Duplicates the straight line on the plot |
Select the well in "Value" dialog box |
Switch to analysis of the selected well. On distance-drawdown plot selected time points are displayed here |
ESC |
Escape from the straight-line method analysis |
The method can equally be used to estimate the aquifer parameters for steady-state regime intervals of the diagnostic curve (for recharge boundary conditions, for instance). The straight line is parallel to the abscissa axis and is shifted upward or down, the parameter being determined by its intercept on the ordinate axis.
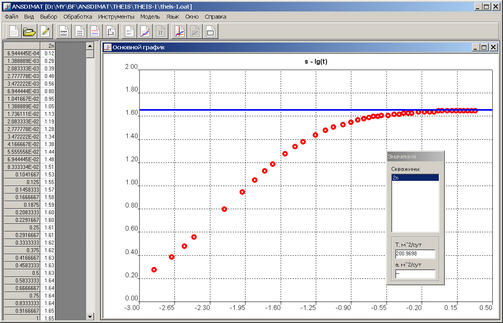
Example of transmissivity estimation by straight line interval of the diagnostic curve for a semi-infinite aquifer with a recharge boundary.
Similar analysis is available for quasi-steady-state flow on the graph plotted for 2 wells.