The type of plot can be selected from the tab "plot" of the "Choose plot" window. This tab provides the list of standard, semi-log or log-log plots to display drawdown as a function of time or pumping rate. ANSDIMAT automatically provides the list of available types of plots for a selected conceptual model and test conditions (constant/variable rate, one/multiwell test, drawdown /recovery observation data). The analytical method for data analysis and interpretation depends on the chosen type of plot.
This tab is directly accessed by selecting "Choose > Plot" from the main menu. It can also be launched by pressing the F5 function key or right clicking on the main plot field.
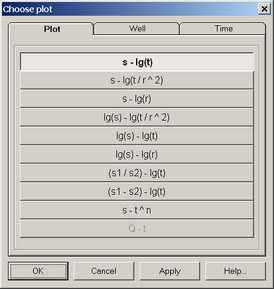
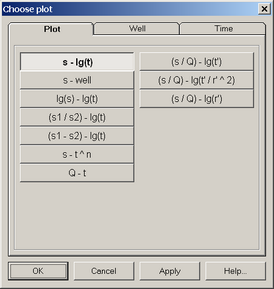
Examples of available types of plot from the "Choose plot" tab.