The tool "Drawdown" is used for quick estimates of drawdowns at variable distances from a well being pumped at a constant rate. These assessments can assist, for example, in planning of aquifer tests or interpreting tests with limited data available. The estimates are enabled for the following conceptual models:
2) Unconfined infinite aquifer;
3) Leaky aquifer and aquifer system;
5) Partially penetrating pumping well in infinite confined aquifer;
9) Strip aquifer;
10) Rectangular aquifer;
11) Circular aquifer; and
12) Constant head tests in confined or leaky aquifers.
Dialog windows require inputs of hydraulic properties and types of aquifer tests. The tool calculates hydraulic heads and drawdown hydrographs in user-selected locations. There is also a possibility to calculate maximum drawdowns for steady state conditions.
Most of drawdown calculations are conducted for constant rate tests from a single pumping well. Exceptions are: constant head tests, slug tests and infiltrometer tests.
All dialog windows for hydrogeologist workbench have similar views. They usually show a sketch of the selected conceptual model and contain fields to input parameters. Required parameter units are usually shown near corresponding fields. It is possible to enter pumping rates (Q) and times (t) in other units, when pressing simultaneously SHIFT (or CTRL) and mouse button.
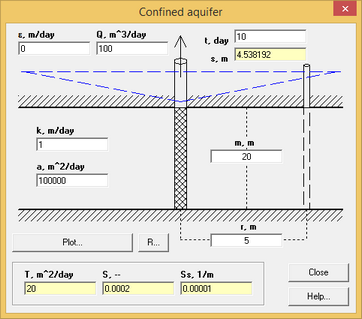
Example of hydrogeologist workbench dialog window.
Explanation table for fields and main options
Text box "Q, m^3/day" |
Constant pumping rate of a well |
Text box "ε, m/day" |
Recharge rate |
Text box "t, day" |
Time at which the drawdown is calculated. When this field is changed, the the drawdown is automatically recalculated (see Field "s, m"). This field is also used to plot drawdown hydrograph. By default, this is the maximum time for drawdown plotting |
Text box "s, m" |
This field shows the calculated drawdown. In some dialog windows, it is possible to enter a value in this field to calculate pumping rate |
Button "Plot" |
Opens the dialog window "Plot" and plots drawdown hydrograph for the times between 0.0001 day (or 0.01 min for slug tests) and the time indicated in text box "t, day" |
Button "R" |
Opens the dialog window "Recovery" |
Text box "T, m^2/day" |
Transmissivity of aquifer |
Text box "S, --" |
Storage coefficient of aquifer |
Text box "Ss, 1/m" |
Specific storage of aquifer |
Other options and fields of hydrogeologist workbench are explained in the text below. Any changes in the dialog windows result in the automatic updates of calculated drawdown values.
Some dialog windows contain auxiliary fields, highlighted in yellow color. They show calculated parameters based on other parameter inputs. For example, the transmissivity value is based on thickness and hydraulic conductivity. When values are entered in these highlighted fields, calculations are conducted for other dependent parameters (e.g. hydraulic conductivity based on transmissivity and thickness).
The dialog window "Recovery" is used to calculate water level recovery for specified times and to plot water level recovery hydrographs. This window opens after pressing button "R" (see the table above)
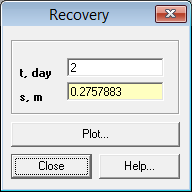
Dialog window "Recovery".
Explanation table
Text box "t, day" |
Time for which recovery is calculated. The time is counted from the end of pumping and Its default value corresponds to the time specified for drawdown calculation in the hydrogeologist workbench dialog window. When this field is changed, the recovery value is automatically recalculated (see Field "s, m" below). This field is also used to plot water level recovery hydrograph. By default, this is the maximum time for recovery plotting |
Text box "s, m" |
Calculates residual drawdown during recovery process assuming that duration of pumping is equal to time specified for drawdown calculation in ANSQUICK dialog window. |
Button "Plot" |
Opens dialog window "Plot" and plots drawdown hydrograph for the times between 0.0001 day and the time indicated in text box "t, day". |
The dialog window "Plot" is used to plot water level drawdown and recovery hydrographs for selected conceptual models. Several plots can be displayed at the same time. All plots are redrawn after pressing the F5 key, and individual plots are redrawn (with random colors) after the mouse click on the selected plot area.
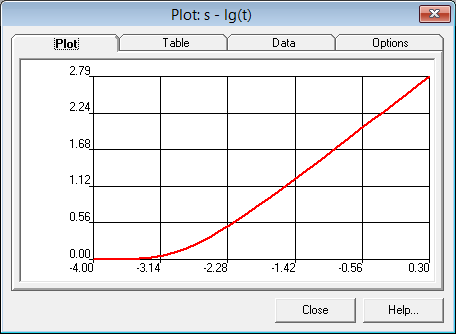
Dialog window "Plot".
Explanation table
"Plot" tab |
Dialog window "Plot" |
|
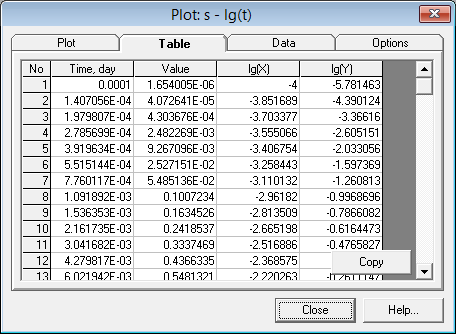
"Table" tab |
Table view of plotted drawdown or recovery hydrographs |
|
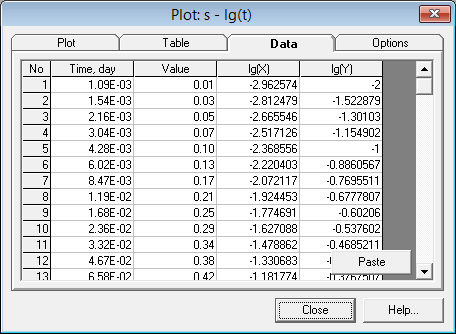
Column "N" |
Sequential number |
|
Column "Time" |
Time in days (for slug tests - in minutes) |
|
Column "Value" |
Water level change in metres |
|
Column "lg(X)" |
Logarithm of time |
|
Column "lg(Y)" |
Logarithm of water level change |
|
Button "Copy" |
Copy in clipboard for "Time" and "Value" |
|
"Data" tab |
Contains factual data that were input. This allows comparison of factual and calculated drawdown/recovery data for specified parameters of aquifer |
|
Button "Paste" |
Pastes "Time" and "Value" data from clipboard. Remaining fields are calculated based on the two inserted columns. |
|
Buttons "N", "Time", "Value", "lg(X)" и "lg(Y)" |
See tab "Table" |
|
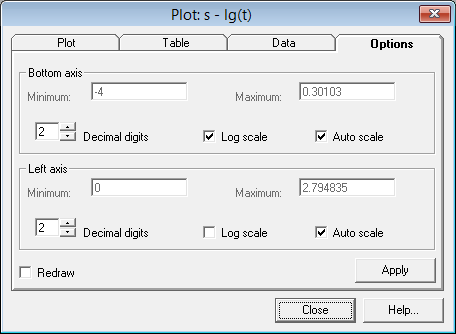
"Options" tab |
Plot options |
|
Frames "Bottom axis" и "Left axis" |
Bottom and left axes options |
|
Text box "Minimum" |
Minimum bound for axes |
|
Field "Maximum" |
Maximum bound for axes |
|
Text box "Decimal digits" |
Decimal places for axes labels |
|
Option "Log scale" |
Displays axis in a log scale |
|
Option "Auto scale" |
Default values for Maximum and Minimum axes bounds |
|
Option "Redraw" |
New plot replaces the previous plot that is erased. When this option is unchecked, use button F5 on the keyboard to redrow plots. |
|
Button "Apply" |
Applies changes in "Options" to plots |
|