The "Step-function" dialog box allows making stepwise approximation of variable rates.
The dialog box opens from the "Tools > Step-function" menu or by right clicking in the lower left corner of the Q – t plot field.
Pumping rate steps are automatically specified in the tab "Rate steps" (press "Auto" button) or graphically (by two intersecting lines appearing when the tabbed dialog is launched). Both auto- and graphically produced data can be manually corrected.
Tabbed dialog "Step-function".
Explanatory table
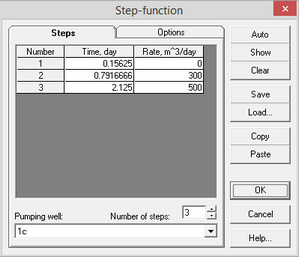
"Steps" tab |
Specifies steps of pumping rate variation |
|
"Number" column |
The step serial number |
|
"Time" column |
Time at which the pumping rate step ends (in days). The first step time must be higher than zero. The time associated with the last step must be higher than or equal to the end of pumping time. SHIFT + left click launches the dialog for converting time from hours, minutes and seconds to days. CTRL + left click launches the information dialog for time conversion from different units |
|
"Rate" column |
Constant rate value during a rate step in cub. m per day. SHIFT + left click launches the dialog for rate conversion from cub. meters or litters per hour, minute or second to cub. meters per day. CTRL + left click launches the information dialog for rate conversion to different units |
|
"Pumping well" combo box |
Selects the pumping well for stepwise rate approximation. All the pumping wells displayed in the pumping rate plot are listed |
|
"Number of steps" text box |
Number of rate steps in the selected well (not exceeding 999) |
|
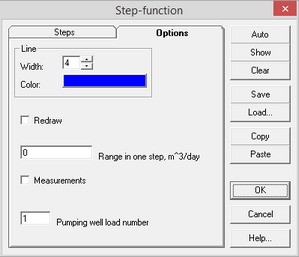
Tab "Options" |
Options for displaying plot and loading data |
|
"Line" frame |
Appearance of the rate-approximating line |
|
"Width" text box |
Line width |
|
"Color" button |
Edit the line color |
|
"Redraw" option |
Option to redraw the pumping rate plot as the new rate approximation is displayed (press "OK" or "Apply" buttons) |
|
"Range in one step" text box |
Specifies a range of rate values for one rate step in auto approximation (see "Auto" button). The default value is zero, any rate variation is producing a separate rate step |
|
"Measurements" option |
The option is active when "Range in one step" is zero. The end time of the step is determined by the time taken to measure the pumping rate. Otherwise, the end time of the stage is determined by the time between two measurements with different pumping rates |
|
"Pumping well load number" text box |
If rate approximation data ("Load" button) are loaded from another project (dqstep.at file), the well number in the source data should be specified |
|
"Auto" button |
Automated stepwise rate approximation. ANSDIMAT analyzes the pumping well rate measurements and returns a series of rate approximation. Increasing the value in the field "Range in one step" allows decreasing the number of steps. Auto approximation can be corrected manually |
|
"Show" button |
Displays the result on a plot |
|
"Clear" button |
Lines marking rate approximation are removed from the plot |
|
"Save" button |
Saves input data in the required format. Creates or updates the dqstep.at file |
|
"Load" button |
Loads file (dqstep.at) from another project and applies the rate approximation data for the selected well. If the well number specified in the "Option" tab exceeds the number of wells included in the selected file, a warning message will be generated |
|
"Copy" button |
Copies table to clipboard |
|
"Paste" button |
Pastes stepwise pumping rate approximation from the clipboard. The clipboard should contain two columns: time at which the pumping rate step ends and pumping rate) |
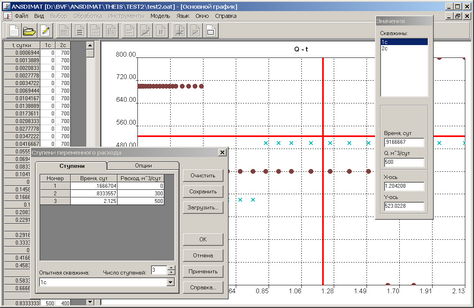
Graphical input of stepwise rate approximation dialog box.
Explanatory table for rate approximation graphical input
LEFT, RIGHT |
Go to the next measurement |
UP, DOWN |
Go to the next pumping well |
SHIFT + LEFT, SHIFT + RIGHT |
Free movement within the plot |
"1" |
Decrease twice the step width |
"2" |
Increase twice the step width |
"3" |
Reset to the initial step width |
Mouse click in the plot field |
Jump to the nearest measurement for the selected pumping well |
SHIFT + mouse click in the plot field |
Free movement along the plot |
ENTER |
Input selected time and rate to the table in the "Steps" tabbed dialog |
Double mouse click |
|
CTRL + ENTER |
Input selected measurement to the table in the "Steps" tabbed dialog |
ESC |
Escape from the stepwise rate approximation mode |
Time and rate are input to the current line of the table in "Steps" tabbed dialog, then the next line is selected automatically. To input data in a certain line of the table put cursor there and push ENTER button.