Plots can be saved using the menu "File > Aquifer test analysis > Save plot". All the information contained on the main plot is saved as a file with extension *.sat. After selecting this menu item, the user will be prompted to name the file and put it in one of the folders. It is important to keep plots in the same project folder as other ANSDIMAT files for current interpretation.
Saved plots can be opened using menu "File > Aquifer test analysis > Load plot" that opens the dialog window. This menu opens the dialog window "Browse saved plots" that can be used for selecting plots and browsing through plots information.
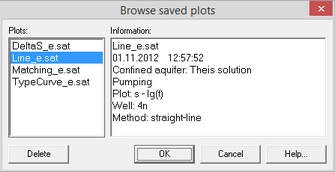
Dialog window "Browse saved plots".
Explanatory table
List "Plots" |
List of previously saved plots as files *. SAT |
Field "Information" |
Brief information about highlighted plot: time of saving, conceptual model, pumping or recovery, pumping and observation wells, interpretation method and solution |
Button "Delete" |
Deletes highlighted plot |
Button "OK" |
Opens highlighted plot that was previously saved with extension *.sat |
Loading selected plot will restore settings and options of the project for the time, when this plot was saved. The saved options include parameter changes through "Analysis > Data correction". After loading a plot, all changes made after its saving will be erased. To restore changes, a new project has to be created from the Editor with the original settings (button "Create").