The window "Observation data symbols" allows to edit shape, size and color of data points in the main plot window. It is activated by selecting "Tools>Observation data symbols" or pressing SHIFT + F4 function key. It is also activated by a double left click on a data point.
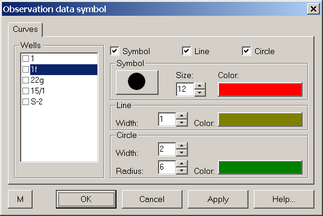
"Observation data symbol" dialog box.
Explanatory table
"Well" list |
List of observation or pumping wells, allows to select each well and edit the appearance of the related observation data symbols |
"Symbol" option |
Activates/deactivates symbols for observation data; applied only for the selected wells |
"Line" option |
Activates/deactivates line for observation data; applied only for the selected wells |
"Circle" option |
Activates/deactivates a circle under the current symbol for observation data; applied only for the selected wells |
"Symbol" frame |
Selection of symbols; applied only for the selected wells |
"Line" frame |
Width and color for of the line connecting observation data points; applied only for the selected wells |
"Circle" frame |
Circle symbol properties |
"M" button |
Saves properties for next projects |
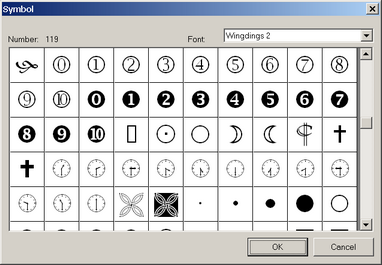
"Symbol" dialog box.
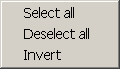
Right mouse click on one of the fields of the well list produces a contextual menu
Explanatory table
Menu "Select all" |
Selects all wells |
Menu "Deselect all" |
Deselects all wells |
Menu "Invert" |
Inverts the current selection |