The "Plot" dialog box allows plotting time- and distance-drawdown plots.
|
- call button in the graphic editor window. |
"Plot" dialog boxes.
Explanatory table
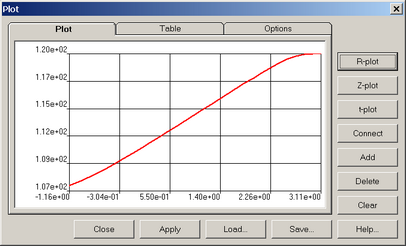
"Plot" tab |
Plot window |
|
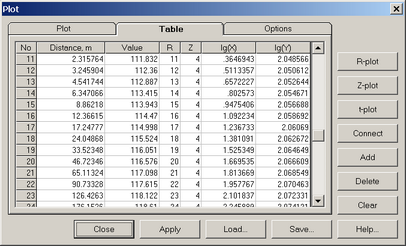
"Table" tab |
Table display of the plot window |
|
"№" column |
Number of the points on the plot |
|
"Distance" column |
Distance from the first point on the plot. For time-drawdown plots, corresponds to time |
|
"Value" column |
Parameter value at the selected point |
|
"R" column |
The block (or node) number along the radial direction in which the value is given |
|
"Z" column |
The number along the vertical direction of the block (or node) for which the value is specified |
|
"lg(X)" column |
Decimal logarithm of the abscissa (time or distance) |
|
"lg(Y)" column |
Decimal logarithm of the ordinate |
|
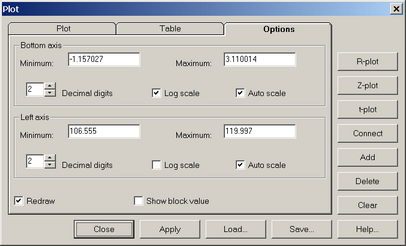
"Options" tab |
Options for displaying the plot |
|
"Bottom axis" and "Left axis" frames |
Displaying coordinate axes |
|
"Minimum" text box |
The minimal value along the coordinate axis |
|
"Maximum" text box |
The maximal value along the coordinate axis |
|
"Decimal digits" text box |
The decimal number for coordinate axes values |
|
"Log-scale" option |
Displays coordinate axis in logarithmic scale |
|
"Auto scale" option |
The minimal and maximal coordinate values are default |
|
"Redraw" option |
Redraws the plot and clears the previous version |
|
"Show block value" option |
Draws a horizontal line on the plot indicating the value in the current block (or node) |
|
"R-plot" button |
Automatically plots a radial graphs for the specified parameter, including all the points/blocks in the selected layer |
|
"Z -plot" button |
Automatically plots a vertical graphs for the specified parameter, including all the points/blocks in the selected column |
|
"t -plot" button |
Automatically plots the time-drawdown plot for the current block (or node): for output file data only |
|
"Connect" button |
In case the new point of the plot ("Add" button) is more than one block (or node) apart from the previous one, the plot is automatically plotted through all intermediate nodes |
|
"Add" button |
Plots a new point for the selected block (or node) |
|
"Delete" button |
Deletes the last point from the plot |
|
"Clear" button |
Deletes all point to plot a new plot |
|
"Close" button |
Close the "Plot" dialog |
|
"Apply" button |
Applies the changes made at "Option" tab |
|
"Load" button |
Loads dat-file and display it on the plot |
|
"Save" button |
Saves plot as a dat-file |