The "View" tab of the "Matching parameters" dialog box allows defining the appearance of calculated curves and their starting and end points. Changes can be made for selected observation wells (checkmark) as well as for a individual well.
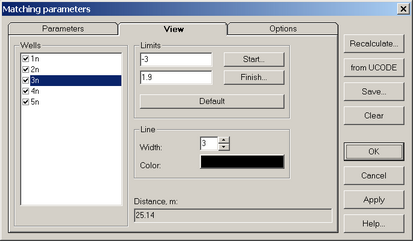
"Matching parameters" dialog: calculation curve appearance settings.
Explanatory table
"Wells" frame |
List of the observation wells displayed in the main plot window and possibility to de/select them |
"Limits" frame |
Text boxes to input the starting and end points of the calculation curve |
"Start" button |
Defines the calculation curve starting point on the plot |
"Finish" button |
Defines the calculation curve end point on the plot |
"Default" button |
Calculation curve is plotted from the minimal through maximal abscissa values |
"Line" frame |
Width and color of the curve |
"Distance" text box |
Distance from the selected observation well and the pumping well (in case of several pumping wells, distances must be slash-separated) |
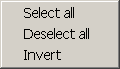
Right mouse button click launches a contextual menu
Explanatory table
"Select all" menu |
Selects all wells |
"Deselect all" menu |
Deselects all wells |
"Invert" menu |
Inverts the current selection |
When going to the plot window ("Start" and "End" buttons) a red vertical line appears on the diagnostic curve plot that indicates the starting or the end points of the calculated curve.
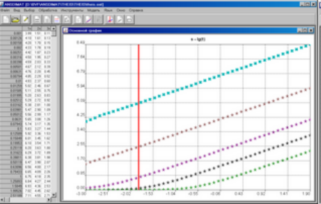
Specifying the calculated curve starting and end points.
Vertical line is moved by LEFT and RIGHT keys or by clicking in the appropriate point of the plot. If key buttons are used, the step width is regulated by the following keys:
"1" – reduces the step twice,
"2" – increases the step twice,
"3" – reset to initial step value.
To return to the "Matching parameters" dialog push the ENTER key or double click to save the specified starting or end points; to abandon changes push ESC button.