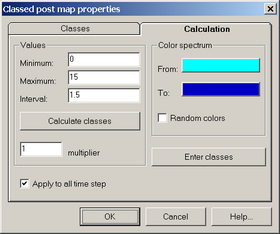
The "Classed post map properties" dialog box allows to find the maximal and minimal parameter value within the grid, group the values into classes (zones) and highlight them with color on the model.
|
- call button in the graphic editor window. |


"Classed post map properties" dialog boxes.
Explanatory table
"Classes" tab |
Window for displaying and editing the outlined zones |
|
"№" button |
The number of the zone |
|
"Minimum" column |
Minimal value in the outlined zone (more than or equal to the prescribed value) |
|
"Maximum" column |
Maximal value in the outlined zone (less than the prescribed value) |
|
"Color" column |
Color of the outlined zone (double mouse click to change the color) |
|
"Number of classes" text box |
Enters the number of zones to be outlined: zones are both added and removed starting from the last one |
|
"Calculation" tab |
Prescribes the values and colors of outlined zones |
|
"Values" frame |
Prescribes values or calculate the outlined zones |
|
"Minimum" text box |
Minimal value for zones calculation |
|
"Maximum" text box |
Maximal value for zones calculation |
|
"Interval" text box |
Parameter intervals for zone outlining. For zone automatic calculation ("Calculate classes" button) the interval is specified based on minimal and maximal parameter values and specified number of zones |
|
"Calculate classes" button |
Automatically determines maximal and minimal values and calculates the interval |
|
"Multiplier" text box |
The factor by which each successive interval is multiplied to make zones irregular (=1 for regular /equal/ zones) |
|
"Color spectrum" frame |
Assign color to the outlined zones. Either gradation between two colors is used or random color is assigned to each zone |
|
"From" button |
Choose the first color for gradation |
|
"To" button |
Choose the last color for gradation |
|
"Random colors" option |
Option for assigning random color to each zone |
|
"Enter classes" button |
Displays the outlined zones ("Classes" tab) according to specified value intervals and assigned colors |
|
"Apply to all time steps" option |
Automatically calculates zones ("Calculate classes" button) and outline zones on the grid for all time steps. Is used only for output file |