Well efficiency is determined by interpretation of step-tests. A step test is an aquifer test, where pumping rate increases each step with usually 3-4 steps conducted. Pumping rates and drawdowns are recorded during the tests, and quasi steady state drawdown at the end of each step is used for interpretation.
The step-drawdown test window is accessed from the menu "File> Hydrogeologist workbench > Well efficiency".
The dialog window "Well efficiency" requires the input of drawdown for each pumping rate step. The plot "(s / Q) – Q" is updated automatically based on input data. When the plot "s – Q" is required, this option can be checked in the tab "Options". Checking this option will disable further updates of the drawdown table.
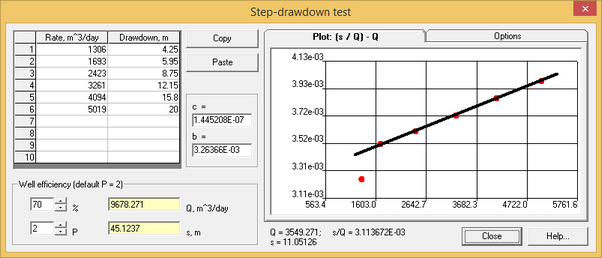
"Step-drawdown test" dialog box.
Explanatory table
Table |
Allows input of pumping rate in m3/day and drawdown in m. A maximum of 10 steps can be entered. Changes in the table result in automatic updates of the plot. Empty fields are excluded from calculations. Press SHIFT (or CTRL) and mouse button for units conversion |
Plot |
Displays a straight line that is displaced by the left or right mouse button. Plot coordinates are shown on the plot tab title. Moving the straight line results in: 1) recalculation of c and b coefficients; 2) re-plotting of pumping rate and drawdown; 3) appearance of information text indicating cursor position coordinates (i.e. pumping rtae, drawdown and s/Q value). On the plot s – Q (see tab "Options" below) straight line is used to verify trend of the factual data |
"Copy" button |
Copies data of the table in clipboard. |
"Paste" button |
Inserts data from clipboard into the table. Only the first 10 rows of data can be inserted |
"c" and "b" text box |
Indicates straight line parameters: c – slope coefficient, b – interception value on the coordinate axis |
"%" text box |
Target well efficiency. Input values between 1 and 99 %. Default value is 70% |
"P" text box |
Power of the function S(Q), as explained below. Values between 1.5 and 3.5 can be input with the default value of 2. When this value is changed, the plot is updated (explained below) |
"Q, m^3/day" text box |
Calculates the pumping rate for the defined well efficiency. When a value is entered in this field, well efficiency (only a number with 0 digital places) and drawdown are re-calculated for the defined pumping rate. Press SHIFT (or CTRL) and mouse button for units conversion |
"s, m" text box |
Calculates drawdown for the defined pumping rate. When a value is entered in this field, well efficiency (only a number with 0 digital places) and pumping rate are re-calculated for the defined drawdown |
"Options" tab |
This tab shows: 1) Maximum and minimum values that are used for the plot; 2) Number of digits for Axis labels; and 3) Check box "Plot: s - Q". When this box is checked, the plot "s - Q" is shown. Inputs and calculations are disabled, when the box is checked. The box is automatically unchecked, when data are inserted from clipboard |
Calculations are conducted as a result of straight line displacement on the plot. Coefficients c and b are determined automatically and pumping rates and drawdowns are re-calculated for defined well efficiency.
The following formulas are used in calculations:
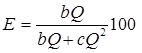
1) well efficiency for a defined pumping rate:
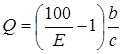
2) pumping rate for a difined well efficiency:
3) drawdown for a defined pumping rate:
![]()
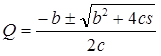
4) pumping rate for a defined drawdown:
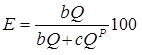
When input data can't be approximated by a straight line, a power value on the equation (P=2) can be replaced by another value within the range of 1.5 - 3.5. Values P > 2 correspond to up-bended curves, while values P < 2 correspond to down-bended curves. The plot is re-drawn in the coordinates (s / Q) – QP-1, and calculation formulas change, as shown below:
1) well efficiency for a defined pumping rate:
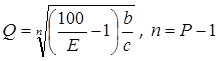
2) pumping rate for a difined well efficiency:
3) drawdown for a defined pumping rate:
![]()
4) Pumping rated for a defined drawdown is calculated iteratively using the drawdown calculation formula.