If pumping rate variations occur during the pumping test, ANSDIMAT can plot the rate vs time Q - t for selected pumping wells (menu "Select > Wells"). Observed rate values are displayed in the table to the left of the plot. window.
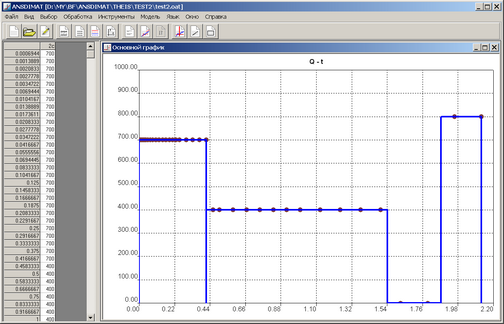
Rate vs time plot Q - t with stepwise rate approximation.
For stepwise rate approximation open the dialog box "Step-function" from "Tools > Step-function" menu or by right click in the lower left corner of the plot field.