ANSDIMAT+ enables interpretation methods based on the relations (ratio or difference) between drawdowns measured in two wells. To some extent, these methods are similar to the methods that are based on single time measurements (so called "point methods") in two wells. The main difference is that in ANSDMAT, the parameters are averaged over the selected time interval while in point methods, parameters are determined from one or a few time measurements. To apply this method, 2 observation wells must be selected (menu "Choose > Well" or F2 key) and the required plot type, for example “(s1/s2) – lg(t)” has to be chosen (menu "Choose > Plot" or F3 key).
The two-wells plot option supports the inversion of drawdown values: inversion can be accessed from the menu "Tools > Inversion" or by Shift+F5. This method also supports ordinate axis swapping: for instance, s1 / s2 can be replaced by s2 / s1.
When plotting the drawdown difference vs lg(t): (s1 - s2) - lg(t), most of conceptual models display a horizontal segment at steady state. The straight-line method can be applied to this segment to determine the the value of transmissivity (accessible from the menu "Analysis > Graphical method").
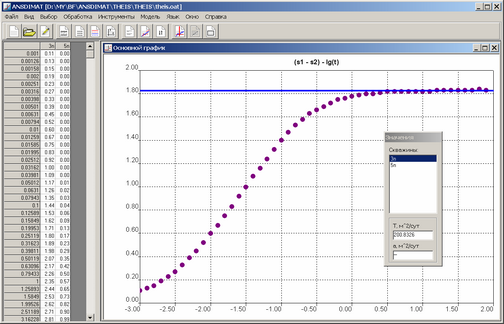
Plot of drawdown difference in two wells: transmissivity estimation by horizontal line.
Plot of drawdown ratio vs lg(t): (s1 / s2) - lg(t). For several conceptual models, the calculated drawdown graph plotted in such a system is independent of transmissivity over the entire time range. In these cases, parameters matching can be achieved using hydraulic diffusivity value alone (menu "Analysis > Direct solution").
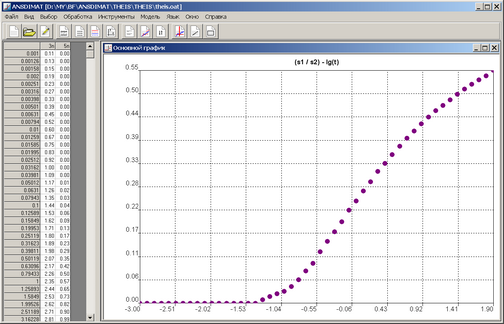
Plot of drawdown ratio in two wells.
The plot based on observation data in two wells can also be used for parameter estimation with the the method of bisecting line.