Step 3. For pumping tests
At this step, information about observation wells can be entered, including their names, drawdown time series and recovery time series. Recovery is defined as a the difference between the water level at the time of measurement and the water level at the end of pumping.
Column 1: entry number
Column 2: well name
Column 3: drawdown time series; a left click on the field opens a pop-up table in which drawdown time series can be entered.
Column 4: recovery time series; a left click on the field opens a pop-up table in which recovery time series can be entered.
Rows: well data, one well per row
Right click on the table fields for enables the cut, copy and paste commands.
Ctrl + left click on the time field will open the dialog window for units conversion.

Step 3. Dialog window for pumping tests
The table must contain at least one observation well. If drawdown or recovery are measured in a pumping well, this well must be included in the table as an observation well.
Drawdown and recovery time series are entered in different tables. If recovery data are also included in the table "Drawdown", they can be transferred to a recovery data table using the "Transfer" dialogue window.

"Transfer data" dialog window
To transfer data from "Drawdown" table to "Recovery":
1) input the entry number for the final drawdown measurement; all entries below the selected final drawdown will be moved to the recovery table;
2) press OK; after the transfer, the size of the "Drawdown" table will be reduced, as all the measurements considered to be recovery are removed from the table;
3) the "drawdown" and "recovery" tables in ANSDIMAT are automatically converted to days as time unit and meters for water levels.
Step 3 for natural fluctuations projects.
At this step, information regarding observation wells can be entered including name, distance to the water body and water level time series.
Column 1: entry number
Column 2: well name
Column 3: horizontal distance to water body in meters
Column 4: water level time series; a left click on the field opens a pop-up table, where time and water level can be entered for the current well.
Rows: well data, one well per row.
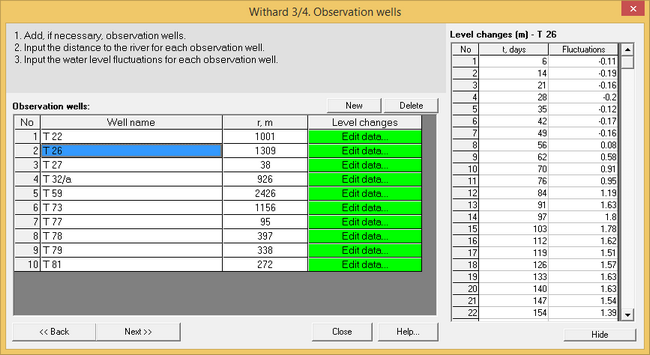
Step 3. Dialog window for natural fluctuations projects