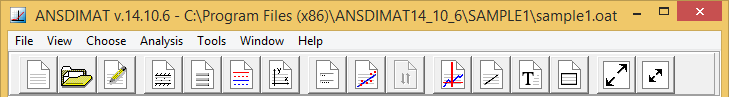
Aquifer test interpretation module is activated by: "File > Aquifer test analysis".
This is the main ANSDIMAT module where aquifer testing projects can be created and interpretation tools are provided. ANSDIMAT+ applies analytical methods (solving direct problem), graphical methods and inverse problem solution methods.
ANSDIMAT+ requires data projects that are created in internal Editor.
Use menu "File > Aquifer test analysis>New project" to create a new data project.
To interpret or re-interpret an existing project, select menu "File > Aquifer test analysis>Open project". This menu item also provides a possibility to edit initial inputs, if required.
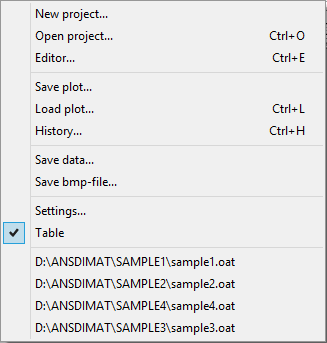
Aquifer Test Analysis menu
|
Menu "New project"
|
Creates a new project for aquifer test interpretation. Opens data input wizard. Each model consists of several files and needs to be saved in a different file folder |
Menu "Open project"
|
Opens existing project in the Editor mode (*.eat) or in the Analysis mode (*.oat) |
|
Menu "Editor"
|
Switches from Analysis mode to Editor mode for open plots. Editor mode is used to view and edit aquifer test data. If changes are done in Editor mode, the project needs to be re-opened in Analysis mode ("File > Aquifer test analysis>Open project") |
|
Menu "Save plot" |
Saves a plot and its settings. Creates a file *.sat |
|
Menu "Load plot" |
Loads saved plots |
|
Menu "History" |
Lists sequence of performed steps for aquifer test analysis |
|
Menu "Save data" |
Saves drawdowns or pumping rate time series as *.csv, *.dat or *.txt files. |
|
Menu "Save bmp-file" |
Saves the current plot as *.bmp file |
|
Меню "Settings" |
Changes settings of plots |
|
Menu "Table" |
Shows / hides data table on the left side of the screen |
|
File list |
List of previously opened files. Direct access to previous files |
|
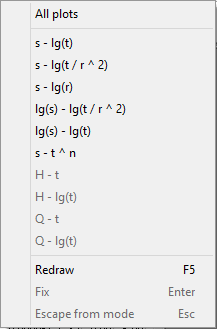
Menu "View" |
||
|
Menu "All plots" |
Displays all plots in all main coordinates in multiple windows |
List of plots |
Enables selection of plot types and coordinate systems for plotting. Some types of plots may not be accessible if input data are not sufficient for plotting |
|
Menu "Redraw" |
Redraws the main plot window. All draft and previous curves are deleted |
|
Menu "Fix" |
This option is only available during interpretation by graphical methods. It fixes the last line or curve, keeps it in the graphical window and allows drawing a new curve/line (i.e. straight line, type curve, etc.). This can also be done with the "Enter" button on the keyboard |
|
Menu "Escape from mode" |
Exit from the Analysis Mode. Can also be done by the "Esc" button on the keyboard |
|
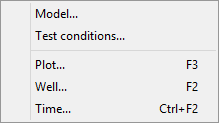
Menu "Choose" |
||
|
Menu "Model"
|
Allows selection of conceptual model (scheme) for aquifer test analysis. Opens dialog window "Choose conceptual model" |
Menu "Test conditions" |
Allows selection of test conditions (i.e. number of pumping wells, recovery or pumping stage of test etc.). Opens dialog window "Test conditions" |
|
Menu "Plot"
|
Allows selection of plot types and their axes for interpretation. Opens dialog window "Choose plot" |
|
Menu "Well" |
Allows selection of observation wells for interpretation. Opens dialog window "Choose plot" |
|
Menu "Time" |
Allows selection of time intervals for interpretation. Opens dialog window "Choose plot" |
|
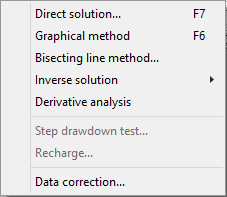
Menu "Analysis" |
||
Menu "Inverse solution"
|
Menu "Direct solution"
|
Interpretation by matching parameters in direct analytical solutions. The menu opens dialog window "Matching patrameters" |
Menu "Graphical method"
|
Interpretation by graphical methods: straight-line method and method of type curves. The method is selected automatically based on conceptual model and plot type |
|
Menu "Bisecting line method" |
Determines hydraulic diffusivity by bisecting line method. Opens dialog window "Bisecting line method" |
|
Menu "Inverse solution" |
||
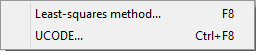
Submenu "Least-square method" |
Solves inverse problem by least-square method. Opens dialog window "Automatic matching" |
|
Submenu "UCODE" |
Solves inverse problem by UCODE method. Opens dialog window "Inverse solution (UCODE)" |
|
Menu "Derivative analysis" |
Applies derivative analysis (as switch on/off) Derivative analysis is applied for plots in coordinates s – lg t for pumping tests and slug tests. When derivative analysis is "on": 1) Drawdown derivative is plotted against lg t; 2) In Direct solution mode (menu "Direct solution"), interpretation curves are additionally plotted for drawdown derivatives; 3) for some conceptual models, graphical methods are available, when factual data are plotted as derivatives |
|
Menu "Step drawdown test" |
Evaluates the efficiency of pumping well. The menu becomes available after opening the "s - lg t" plot and in the presence of a file with time steps for variable pumping rate |
|
Menu "Recharge" |
Assessment of recharge. The menu becomes available after loading water level fluctuations in observation wells (for the "Natural fluctuations" model) on the "s - t" plot |
|
Menu "Data correction" |
Allows temporal changes of aquifer testing data in Editor mode. Opens the dialog window "Data correction". Changes made are not saved and remain active only for the current session of ANSDIMAT |
|
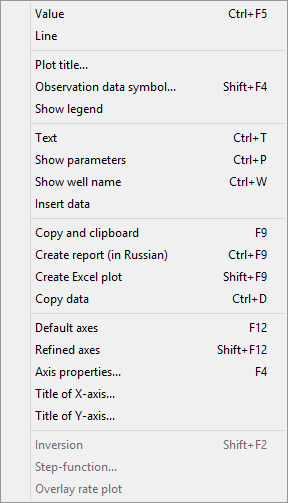
Menu "Tools" |
||
|
Menu "Value"
|
Allows selection of factual point data on "Main plot" window, shows point value and allows exclusion of selected points |
Menu "Line"
|
Moves straight line within the main plot window and determines transmissivity from the line position |
|
Menu "Plot title" |
Creates and modifies plot title. Opens dialog window "Caption" |
|
Menu "Observation data symbol"
|
Selection of settings for curves and symbols on plots. Opens dialog window "Observation data symbol" |
|
Menu "Show legend" |
Inserts legend |
|
Menu "Text" |
Inserts text window in the main plot window. Text can be edited and moved within the plot window |
|
Menu "Show parameters"
|
Inserts text in the main plot window with the last determined parameters |
|
Menu "Show well name" |
Inserts borehole IDs in the main plot window |
|
Menu "Insert data" |
Paste from the clipboard data measurements water level on the plot s - lg(t), lg(s) - lg(t) or s - t. There should be two columns in the clipboard: time and water level change. Data is displayed on the active plot as points, the size and color of which are set in the window "Setting" |
|
Menu "Copy and clipboard"
|
Duplicates the main plot window and copies it to the clipboard |
|
Menu "Create report (in Russian)" |
Creates aquifer test interpretation report. This option is available in Russian language only |
|
Menu "Create Excel plot" |
Exports a plot and the corresponding data series in EXCEL. Opens EXCEL file |
|
Menu "Copy data" |
Copies data series to clipboard |
|
Menu "Default axes"
|
Assigns automatic scales for coordinate axes based on their minimum and maximum values |
|
Menu "Refined axes"
|
Assigns scales for each coordinate axis based on the best view for plotting purposes |
|
Menu "Axes properties"
|
Manual set up for axes scales and properties. Opens dialog window "Axes properties" |
|
Меню "Title of X-axis" |
Replaces X-axis title |
|
Меню "Title of Y-axis" |
Replaces Y-axis title |
|
Menu "Inversion"
|
Changes axes types. For example replaces axes (s1 / s2) - lg(t) by (s2 / s1) - lg(t) and vice versa. This option is used for analysis of drawdowns in two observation wells |
|
Menu "Step-function" |
Defines time steps for variable pumping rate. Opens dialog window "Step-function". This menu is enabled when: 1) Variable Rate is selected in "Choose>Test conditions" 2) "Q-t" plot is selected in "Choose>Plot" To set up a step-function, time-variable pumping rate is required |
|
Menu "Overlay rate plot" |
Plots time-variable pumping rate on the main plot with time-variable drawdown |
|