Step 2 for pumping tests
Defines pumping well details and their pumping rates.
Right click on a field enables the cut, copy and paste commands.
The first column contains the number of the entry.
The second column is used for entering the pumping well name.
The last two columns are used to enter the pumping rate, either constant (third column) or variable (fourth column).
Constant pumping rate is entered in column "Q" in cubic meters per day.
Variable pumping rate can be entered and edited by clicking with the mouse on the field "Variable pumping rate". It opens an additional table for the selected well where the variation of pumping rate can be entered against time.
Ctrl and left click on the time or rate fields will open a dialog window for units conversion.
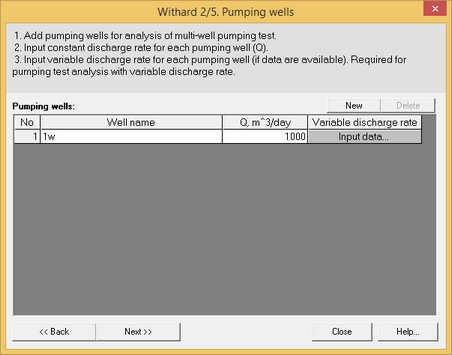
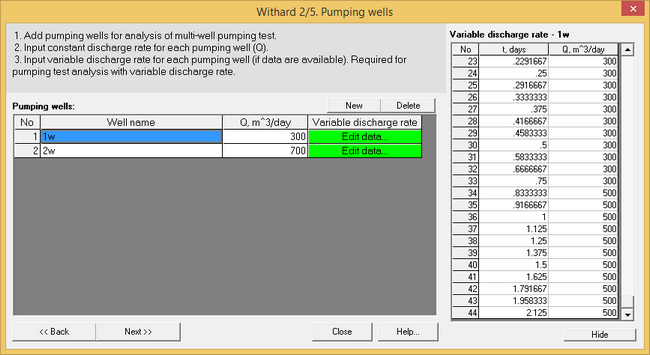
Step 2. Dialog windows for pumping tests
The property table must contain at least one well. Additional data can be pasted from the clipboard, adding new rows for each new well. It is not possible to copy and paste partial information into the table.
Step 2 for slug tests
Details of the slug test can be entered in this table
The first column records the entry number.
The second column is used to enter the well name.
The third column is used to record the initial drawdown: this field is mandatory.
The fourth column records the screen radius: this field is mandatory.
Recovery can be entered in the fifth column. A left click on the field will open a new table where the recovery can be entered against time. Recovery is calculated as the difference between the water level at the time of the measurement and the initial water level. The last recovery measurement should be similar to the initial drawdown
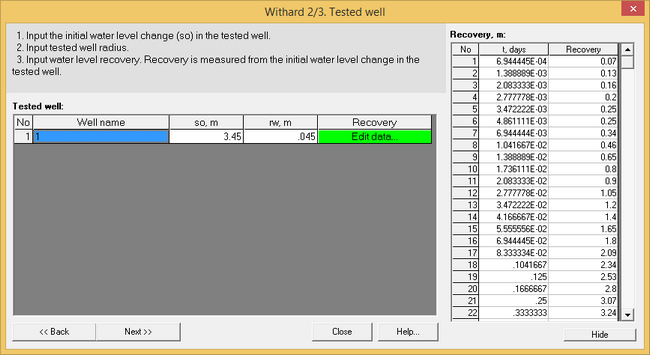
Step 2. Dialog window for slug tests
The standard slug test does not support multiple wells: only the tested well can be entered. Multiple observation wells can be assigned in the extended Editor window.
Step 2 for natural fluctuations projects (i.e. impact of river fluctuations on groundwater levels).
The table allows recording the parameters for the source impacting the wells. The first column records the entry number, the second column records the sources name.
The source water level is entered in the third and fourth column. If only a single water level is available, it is entered in column 3.
Variable levels can be recorded in column 4. A left click on the field opens a new table where the variation of the water level with time can be entered.
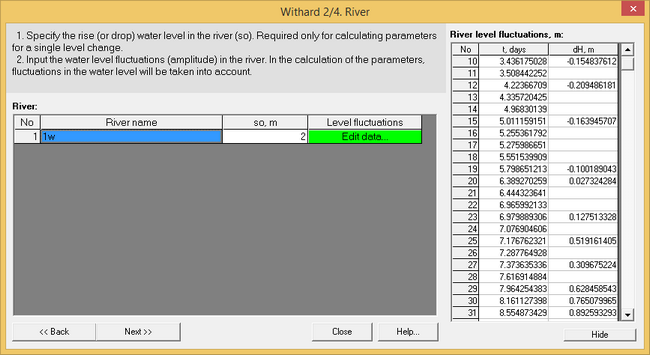
Step 2. Dialog window for natural fluctuations projects
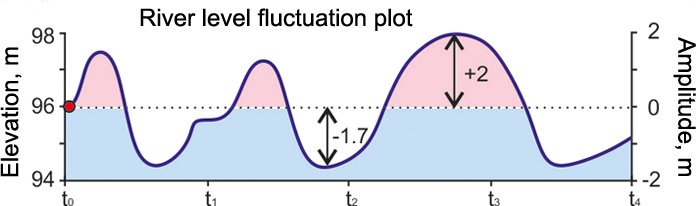
Example of river hydrograph. Water level variations at different times are entered in the table above
Natural fluctuations projects supports only one external factor of hydrodynamic influence (i.e. a river or other superficial water body).